Disclaimer
The views and opinions expressed by the author are for informational purposes only and do not constitute financial, investment, or other advice.
$90,422.00
-1.10%$3,106.42
-0.62%$236.79
7.57%$625.11
-0.19%$1.015
5.03%$0.350498
-8.55%$0.999561
-0.10%$3,106.11
-0.69%$0.709897
-3.32%$0.195703
3.28%$36.38
4.40%$0.00002406
-4.10%$5.57
3.07%$90,024.00
-1.33%$3,674.99
-0.85%$3.67
-2.44%$3,106.23
-0.69%$14.24
0.78%$0.00002108
-3.94%$445.45
1.71%$5.59
5.85%$6.06
-1.28%$7.53
-2.67%$89.23
3.15%$12.31
0.51%$0.19616
27.48%$3,266.58
-0.76%$8.89
1.39%$0.994691
-0.51%$9.28
3.05%$0.158464
-5.60%$27.28
14.76%$0.150633
5.07%$3.75
-1.08%$505.94
-4.45%$0.00005331
24.04%$1.31
1.69%$0.419225
10.02%$1.002
-0.03%$0.08502
5.36%$22.16
-0.79%$3.25
35.60%$1.95
0.86%$0.692509
11.75%$6.99
-2.10%$148.34
1.10%$45.17
2.16%$4.50
7.10%$1.001
-0.10%$26.23
5.21%$166.90
-0.31%$0.730588
-0.50%$0.00025186
-2.00%$0.02995529
10.62%$6.13
14.91%$1.33
2.81%$0.52051
1.51%$5.23
4.17%$1.74
8.46%$0.742345
1.92%$5.70
0.93%$0.201777
5.44%$1.37
-1.51%$3,100.64
-0.79%$1.81
-3.15%$0.176499
-2.68%$5.93
21.13%$1.28
13.03%$0.59465
6.58%$3,478.50
-0.76%$1.61
-14.12%$0.44208
4.12%$0.187111
-3.85%$2.32
-0.34%$90,546.00
-0.66%$3,251.78
-0.62%$1.48
5.25%$3,179.78
-0.75%$0.955134
4.33%$68.52
2.78%$90,538.00
-1.11%$10.92
0.46%$1,489.38
3.06%$291.07
7.29%$9.69
0.97%$0.02347132
8.99%$83.17
26.49%$1.20
6.87%$18.21
0.13%$0.02894941
9.37%$0.02111323
-6.85%$0.00000111
-0.08%$0.02227071
4.28%$1.19
1.56%$0.01188177
2.01%$6.03
2.18%$0.664732
4.05%$0.00000263
-8.80%$3.07
-0.97%$3,095.97
-1.04%$90,481.00
-0.47%$0.418908
10.16%$0.464145
2.81%$0.640344
1.67%$248.74
7.22%$1.36
-4.23%$90,484.00
-0.67%$0.00004593
1.82%$1.28
3.03%$0.976407
4.19%$5.42
1.87%$90,266.00
-0.86%$12.42
5.54%$10.96
-8.50%$5.70
6.47%$0.00205455
-7.77%$0.755483
-2.84%$0.356475
19.46%$30.84
5.55%$0.818925
7.38%$3.29
-2.55%$1.24
0.70%$1.11
-3.18%$38.13
-1.76%$0.675982
2.79%$0.136062
1.42%$0.99819
0.19%$0.00738123
-0.64%$0.398352
11.82%$0.348901
-8.94%$3,105.86
-0.58%$0.01040489
-2.20%$0.154016
4.27%$3,188.26
-0.91%$0.255924
7.21%$255.96
0.73%$2.23
6.86%$0.00662032
25.58%$0.072215
5.40%$239.52
7.44%$0.04361304
37.15%$42.86
10.17%$0.995839
-0.22%$0.763565
11.15%$2.64
-5.10%$2,563.73
-0.07%$3,105.20
-0.70%$0.0089043
-5.52%$0.00011186
9.09%$1.34
3.01%$18.07
4.41%$0.01324523
2.85%$0.638848
-5.14%$0.624555
-17.15%$1.28
3.06%$32.81
3.87%$0.163224
4.51%$0.589333
-3.66%$0.575694
-5.48%$3,367.01
-0.79%$0.082549
2.84%$0.148378
3.19%$0.081407
-0.23%$1.65
3.43%$1.92
2.54%$1.071
0.77%$1.47
2.17%$1.00
0.01%$90,661.00
-0.88%$0.258446
3.89%$9.08
1.69%$3,108.32
-0.68%$4.25
-3.07%$0.00000024
-2.01%$0.508815
-11.99%$2,563.85
-0.17%$0.00146337
-5.41%$0.998275
-0.12%$0.00000049
1.47%$3,097.11
-0.99%$0.04923305
-1.04%$0.256168
5.83%$90,530.00
0.24%$0.063406
5.50%$0.156895
3.79%$52.67
6.16%$0.068533
15.42%$0.427594
6.54%$2.45
-0.88%$90,355.00
-0.87%$3,106.65
-0.55%$1.065
0.33%$0.01432679
-1.48%$8.85
1.11%$0.053706
4.24%$0.999492
-0.02%$0.382022
38.09%$3,109.73
-0.78%$3.69
2.62%$98.56
-1.09%$0.999313
25.48%$0.975335
-1.19%$0.996471
0.54%$0.327225
10.83%$3,328.65
-0.60%$1.066
-0.12%$6.55
4.81%$11.11
3.67%$0.00121991
-7.87%$0.00490443
12.12%$0.30824
5.36%$0.390598
61.68%$0.0413195
2.61%$3,238.27
-0.95%$0.00736097
2.43%$0.00
-6.16%$2.97
7.09%$0.02222774
-20.67%$0.01972163
8.01%$0.00211764
3.00%$0.72462
-2.36%$3.44
4.28%$1.00
-0.59%$3,422.37
-0.76%$1,815.59
-1.02%$0.651992
2.47%$42.50
3.42%$1.00
-0.05%$0.512941
8.89%$0.352948
1.31%$1.64
0.39%$90,262.00
-0.99%$28.77
2.18%$0.00005089
-2.56%$0.340409
15.89%$21.67
5.40%$3,293.26
-0.91%$1.62
4.63%$1.32
8.29%$0.033802
0.35%$0.33117
76.31%$90,081.00
-0.83%$0.384651
4.74%$0.590375
-5.95%$4.98
2.77%$0.364631
4.77%$0.03214891
2.60%$0.00062257
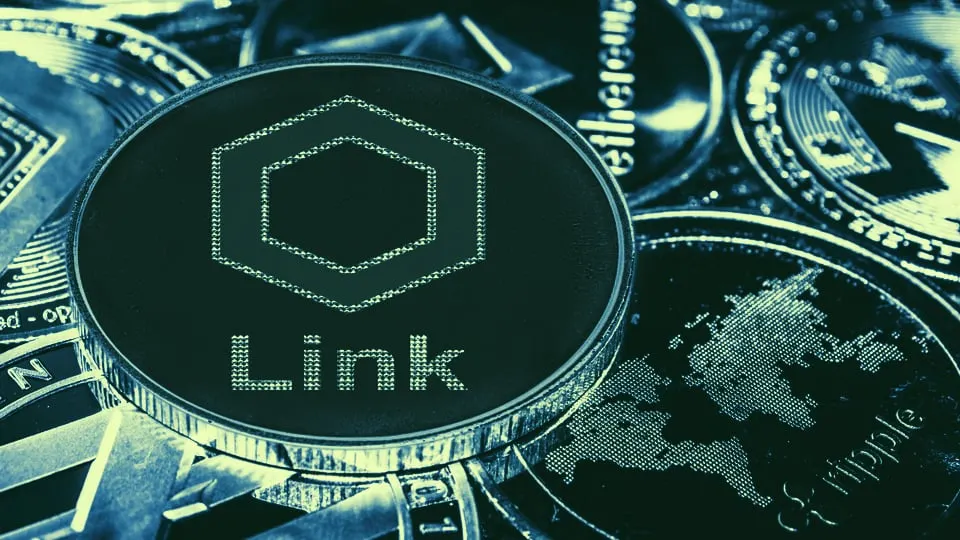
-1.89%Chainlink (LINK), the 13th-largest cryptocurrency by market cap, is today’s biggest winner within the top 20 coins, having shot up in price by more than 11% since this morning.
The month of June has been shaky for Chainlink in terms of price. On June 12, the price of LINK sank (right along with the rest of the market when Bitcoin crashed) by around 10%, reaching a monthly low of about $3.90 per coin.
Since then, however, LINK has been on a tear, with today’s high of $4.80 per coin nearly matching the all-time high of $4.95 that the cryptocurrency hit in early March. That’s a 15% price surge since yesterday’s price of $4.18.
Why the sudden interest in Chainlink? Its development over the last few weeks could have a lot to do with it. You could say LINK qualifies as a “DeFi token,” given how Chainlink’s tech is being integrated across the nascent decentralized finance industry—and even though it’s not currently listed on DeFiMarketCap’s rankings.
Not too long ago, the DeFi market was still recovering from the coronavirus crash. In April, total market cap for DeFi tokens, as measured by DeFiMarketCap, hit $1 billion. In two months, that total has grown to more than $6 billion, with Compound’s COMP currently leading the day. (Chainlink’s reported market cap of roughly $1.6 billion would be enough to come in second, if it were ranked among DeFi tokens.)
Chainlink has joined forces with several leading DeFi platforms this month, including liquidity protocol Kyber Network, which integrated Chainlink in mid-June to give users the option of verifying on-chain prices for token swaps. This was followed by news that decentralized VPN service Orchid would work with Chainlink to provide new pricing oracles that would allow Orchid users to better understand the costs of buying bandwidth on the network.
All in all, it's another sign that DeFi is on fire right now. Will it last or is it a 2017-style bubble all over again?
Disclaimer
The views and opinions expressed by the author are for informational purposes only and do not constitute financial, investment, or other advice.