A portmanteau of token and economics, tokenomics is the study, monitoring, and analysis of a crypto project’s market cap, token (or coin) supply, crypto emission rate, and a host of other measurable and publicly available metrics. Also called cryptoeconomics (cryptocurrency + economics), having at least a cursory understanding of tokenomics can help you make better investing decisions.
While the interplay between crypto price movement and tokenomic indicators is complex, it is a good way to do an apples-to-apples — or block-to-block — comparison between various crypto projects and blockchain protocols. While many investors may simply look at the price (“BTC at $29,000” “ETH hits $1,600”), understanding token supply and market cap numbers helps you see the bigger crypto investing picture.
Supply-Side Tokenomics
There are three key supply numbers you should understand: circulating supply, total supply, and max supply. Understanding the interplay between these three metrics and how they are trending can help you make some rough back-of-the-crypto-envelope investing calculations.
Circulating Supply
Circulating supply is the number of tokens that are currently available to be traded, bought, or sold. For many major crypto projects, the circulating supply starts small, increases quickly at the beginning, and gradually tapers off over time. For example, the Bitcoin blockchain started by releasing 50 bitcoin (BTC) every ten minutes — and halves this number every four years. Often called the emission rate, only 6.25 BTC are released every 10 minutes now — with this dropping again to 3.125 BTC in April 2024.
However, some projects see the circulating supply go down over time. This is often done by burning (destroying) tokens intentionally. For example, some projects burn the transaction fees on their protocols which lowers the supply over time; others may do a large one-time burn in order to lower the supply, bolster price support, or increase investor interest.
Max Supply
The max supply is the total number of tokens that can exist of a specific crypto. For example, the max supply of BTC is 21 million while the current circulating supply is approximately 19.4 million (and gradually increasing every ten minutes). Once these numbers match up, you can be assured that no new tokens will be released. For some crypto projects (BTC, BCH, LTC, and more), the max supply will be reached sometime in the near — or distant — future.
For other projects, there is no max supply. This could mean a few things. One, it could mean that new tokens will never stop being created. One example of a protocol without a max supply is the memecoin DOGE. Often denoted by an infinity symbol (∞), this also means that the circulating supply will continue to increase as well.
Other tokens may not have a max supply as their supply can fluctuate based on demand, collateral, and their ties to real-world assets (RWAs). For example, most USD-pegged stablecoins (USDT, USDC, DAI, and more) are collateralized by USD and/or crypto (more collateral = larger supply, less collateral = lower supply). The same flexible supply dynamics hold true for gold-backed cryptos like PAXG.
Total Supply
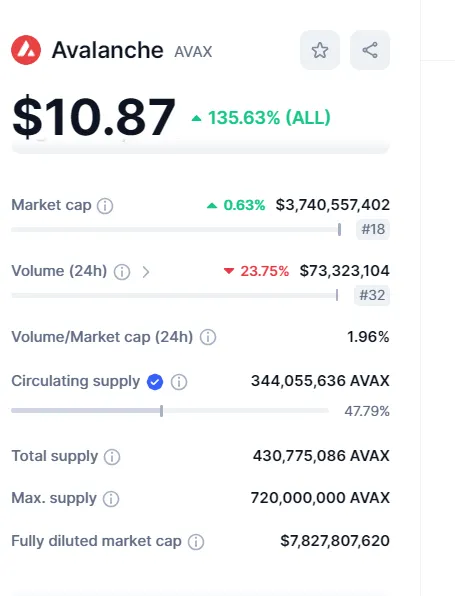
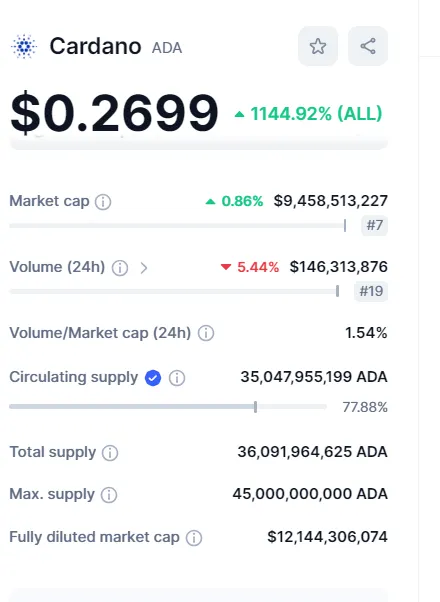
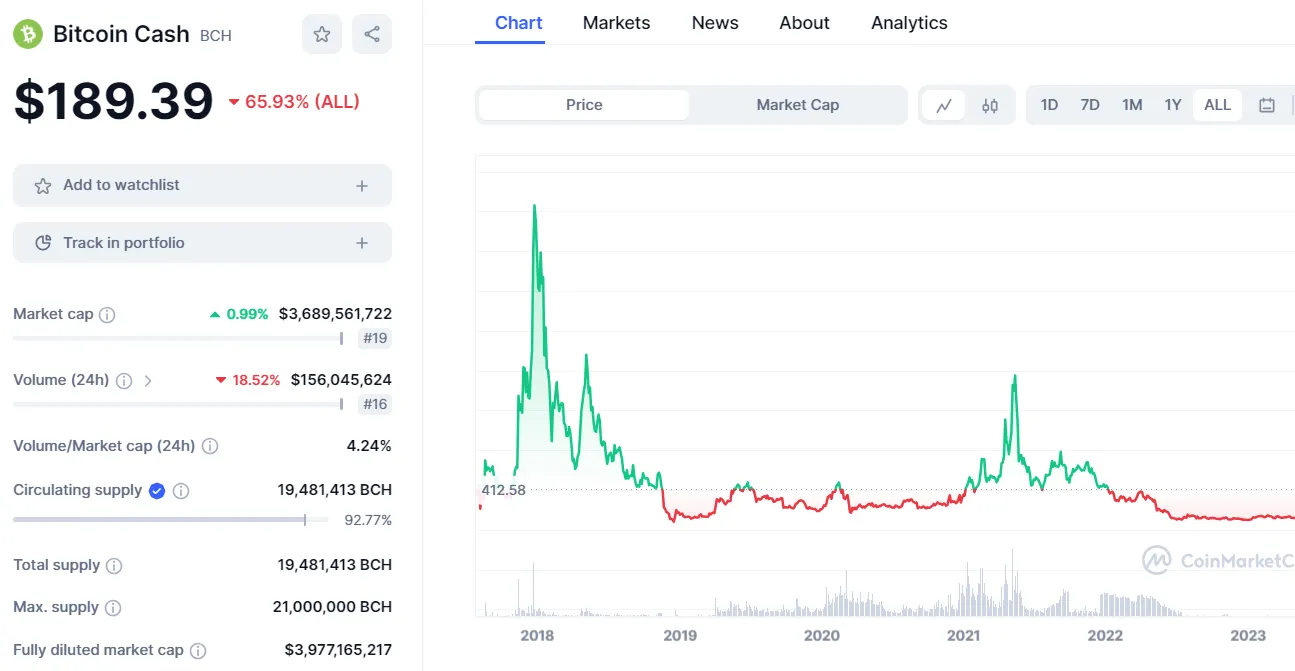
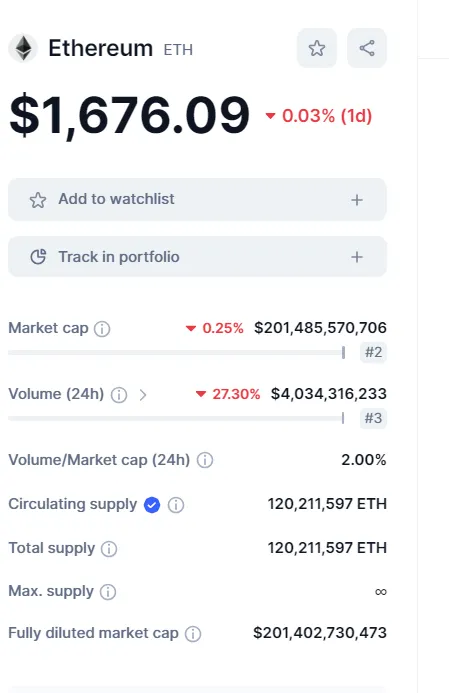
The total supply takes the total number of tokens that have been created and subtracts the number of tokens that have been permanently removed from circulation (typically via burning). While the total supply can also be completely different from the max and circulating supplies, you’ll also often see the total supply be equal to either the max supply or the circulating supply (but usually not both). For example, tokens such as ETH, BCH, and BTC have matching circulating and total supplies. As new tokens are issued that increase the total supply (via mining or staking rewards), they immediately enter the circulating supply as well.
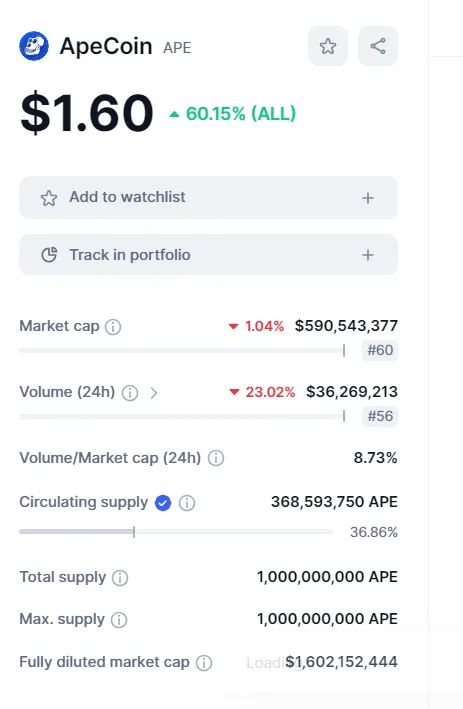
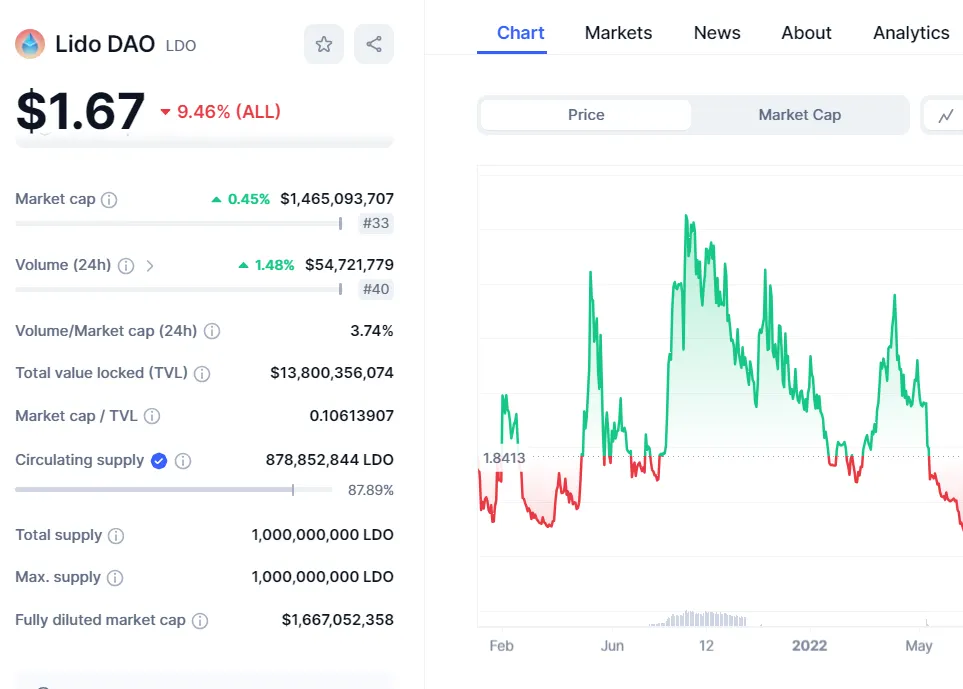
On the other hand, tokens such as APE and LDO each have identical max and total supplies of 1 billion — while having a lower circulating supply. This means that all the tokens were typically created at once, but that some of them have not entered circulation. They may be used to support the project’s treasury, issue crypto rewards, or are vested (temporarily inaccessible) with early team members and investors.
Connecting the Supply Metric Docs with Market Cap Analysis
In order to understand why these supply metrics matter, it’s worth looking at how they affect the two major market cap metrics: market cap and fully-diluted market cap. The market cap is calculated by multiplying the current circulating supply with the current price per token. Using BTC as our example (with the numbers used above), we’d have a market cap of $562.6 billion (29,000 x 19.4 million).
The Bitcoin market cap can go up by one of two ways (or both): token issuance and price appreciation. Even if the BTC price remained absolutely static (not likely but useful for this example), the Bitcoin market cap would increase by $181,250 every ten minutes ($29,000 x 6.25BTC block reward). More easy to understand, any price appreciation would increase the market cap by this price increase multiplied by the circulating supply. If the price shot up to $60,000 per BTC, the market cap with our example circulating supply would be $1.164 trillion (60,000 x 19.4 million).
The fully-diluted market cap takes the current market price and multiplies it by the max supply — typically higher than the current circulating supply. Using our two example BTC prices ($29,000, $60,000) this would equate to fully-diluted market caps of $609 billion and $1.26 trillion, respectively.
While the fully-diluted and standard market caps are different, they aren’t super far apart for BTC at this point because the max supply and circulating supply are close and approaching each together. This makes it easier to calculate price movement and may make it a more appealing investment for crypto enthusiasts. This is because the circulating supply is getting close to the max supply (currently about 92%).
For other projects, there is a much higher delta (difference) between the circulating supply and the max supply. This is an important metric that should be considered when looking at potential crypto investments — particularly ones that you want to buy and hold over a long time period.
For example, Apecoin has a circulating supply of around 37%, so there is a huge difference between the market cap (around $600 billion) and the fully-diluted market cap (around $1.6 billion). What this means is that there must be sustained demand for the new tokens that enter the circulating supply in order to keep the price where it is — and even more demand in order to increase it. If demand remains the same while new tokens enter the supply, the token will drop in price due to basic supply-and-demand eventualities.
How Price Movement Affects Market Cap: Level-Setting Your Expectations
A useful thing to do when forecasting future price movement is to simply calculate how that future price would affect the current market cap (current price x current circulating supply). Oftentimes, this calculation can bring your moon-high price predictions back to an Earth-orbiting reality. Let’s look at an example.
I googled Dogecoin and read “Dogecoin will likely reach $5 in the next decade.” For context, Dogecoin’s DOGE is currently trading around $0.06 and has never traded above $0.70. Dogecoin is already a top-ten project by market cap (currently around $9 billion) with a circulating supply in excess of 140 billion. This would equate to a market cap of $700 trillion (140 billion DOGE x $5). Beyond this, Dogecoin has no max supply and issues an additional 10,000 DOGE every minute which puts downward price pressure on DOGE without additional and sustained demand on the buy side.
Five American dollars isn’t a moon-high price prediction; this prediction is light years away in a distant galaxy. This would not only surpass Bitcoin and other major cryptos, this $700 trillion market cap would dwarf the market cap of the world (currently valued around $116 trillion). This sort of basic calculation can help you make more realistic price predictions than can hopefully weed out off-the-wall price predictions that seem outside the bounds of possibility.
Tokenomic Resources and Next Steps
There are a number of places where you can peruse this tokenomic data for free. Popular options include CoinMarketCap, CoinGecko, and CryptoCompare. In addition, much of this data can also be found on popular crypto exchanges like Gemini, Coinbase, and Kraken — although the aforementioned data-driven sites generally provide more tokenomic data.
This is simply a primer on some general terms and metrics you should know and look at when making investment decisions and is far from comprehensive. In addition, some additional metrics to consider include the daily trading volume, the daily/weekly price change, and a token’s all-time high (ATH) and all-time low (ATL) price.
Disclaimer: This investing series is strictly for informational and entertainment purposes. It should not be construed as financial or investment advice. Do not invest based on price prediction tools or forecasts laid out in this series. Please consult an investing professional or financial planner if you feel you need investment guidance.
Cheat Sheet
- Tokenomics considers various token supply and market cap metrics. These numbers can be utilized to make more prudent investment decisions.
- Key metrics to track include: circulating supply, max supply, total supply, market cap, and fully-diluted market cap.
- The market cap can be calculated by multiplying the circulating supply with the current token price.
- The fully-diluted market cap can be calculated by multiplying the max supply with the current market price.
- Tokens with no max supply will decrease in price without increased and sustained buy-side pressure.
- Tokenomic metrics can be found on various crypto trading sites as well as major crypto exchanges.


